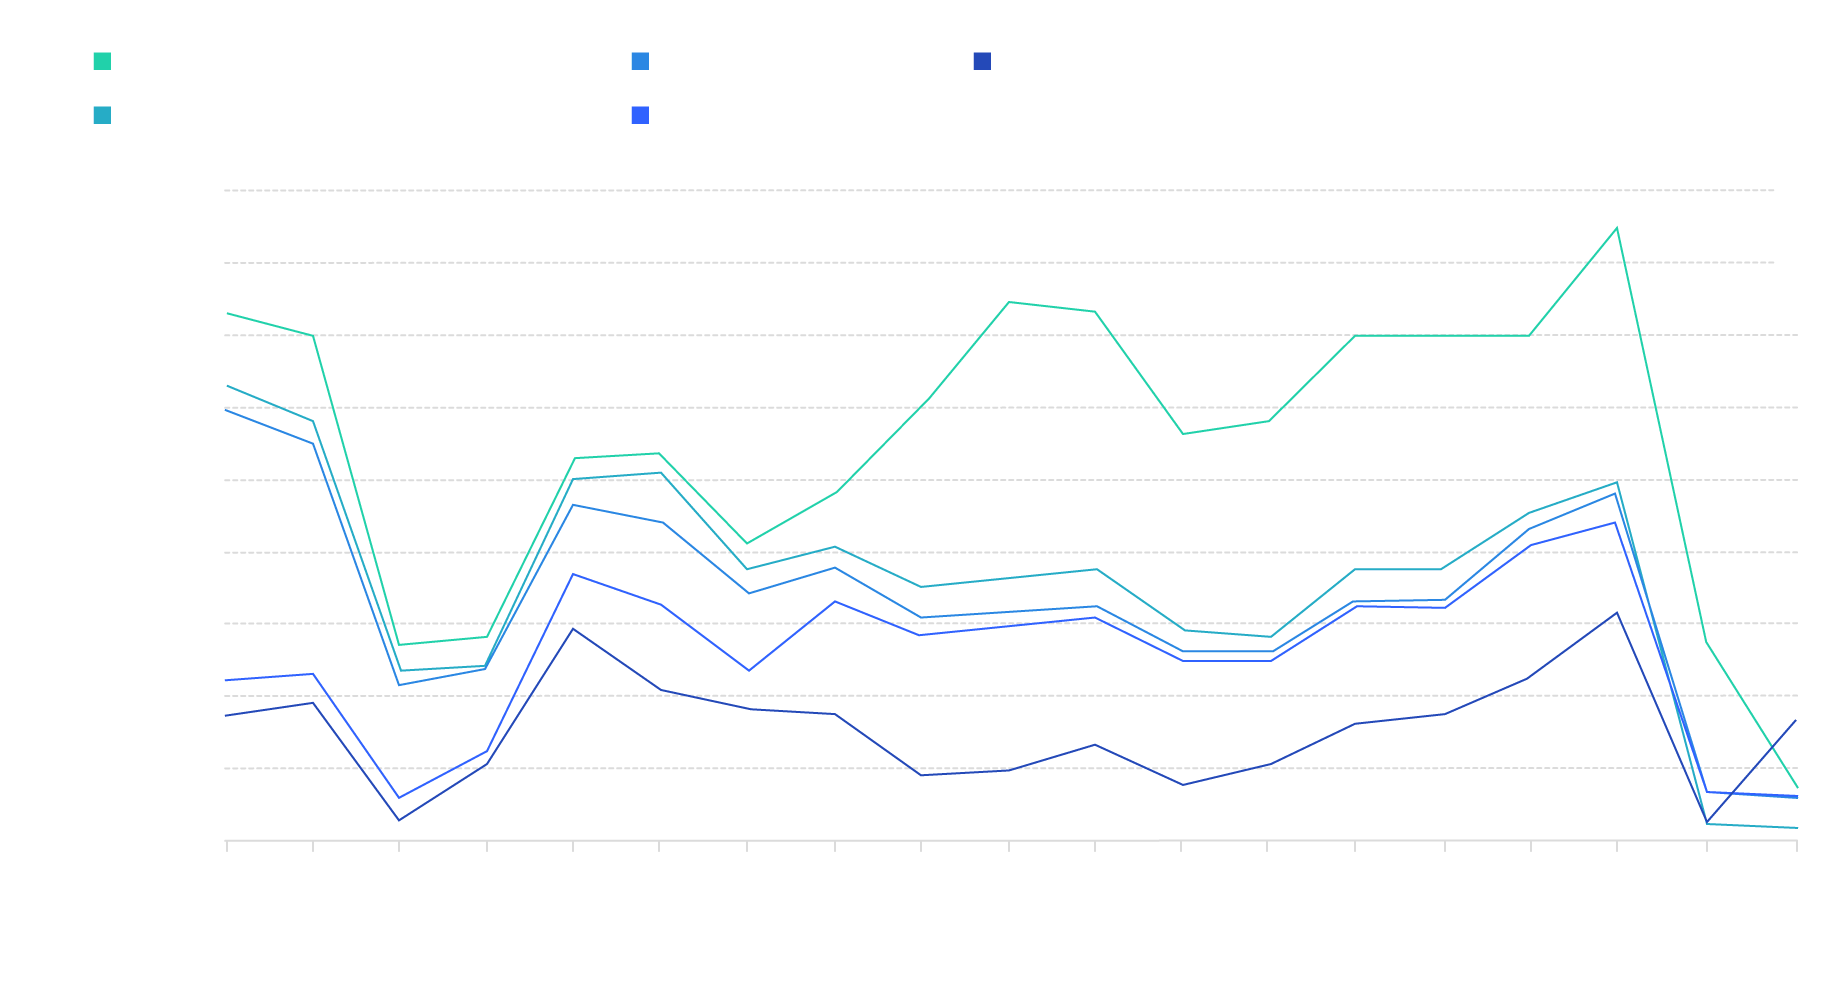
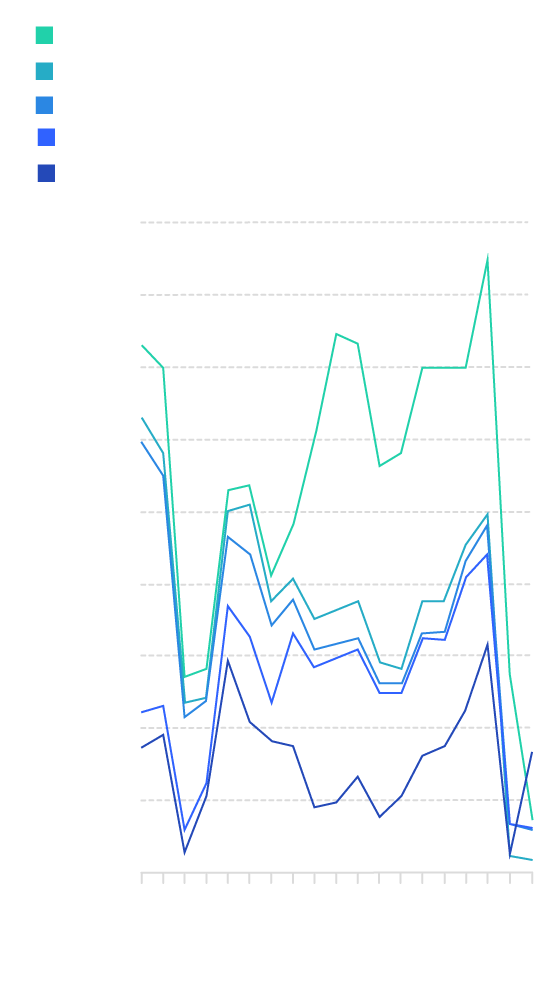
Near East/South Asia
Europe
Africa
Latin America/Caribbean
East Asia
90,000
80,000
Refugee Admissions
70,000
60,000
50,000
40,000
30,000
20,000
10,000
0
‘00
‘01
‘02
‘03
‘04
‘05
‘06
‘07
‘08
‘09
‘10
‘11
‘12
‘13
‘14
‘15
‘16
‘17
‘18*
Fiscal Year
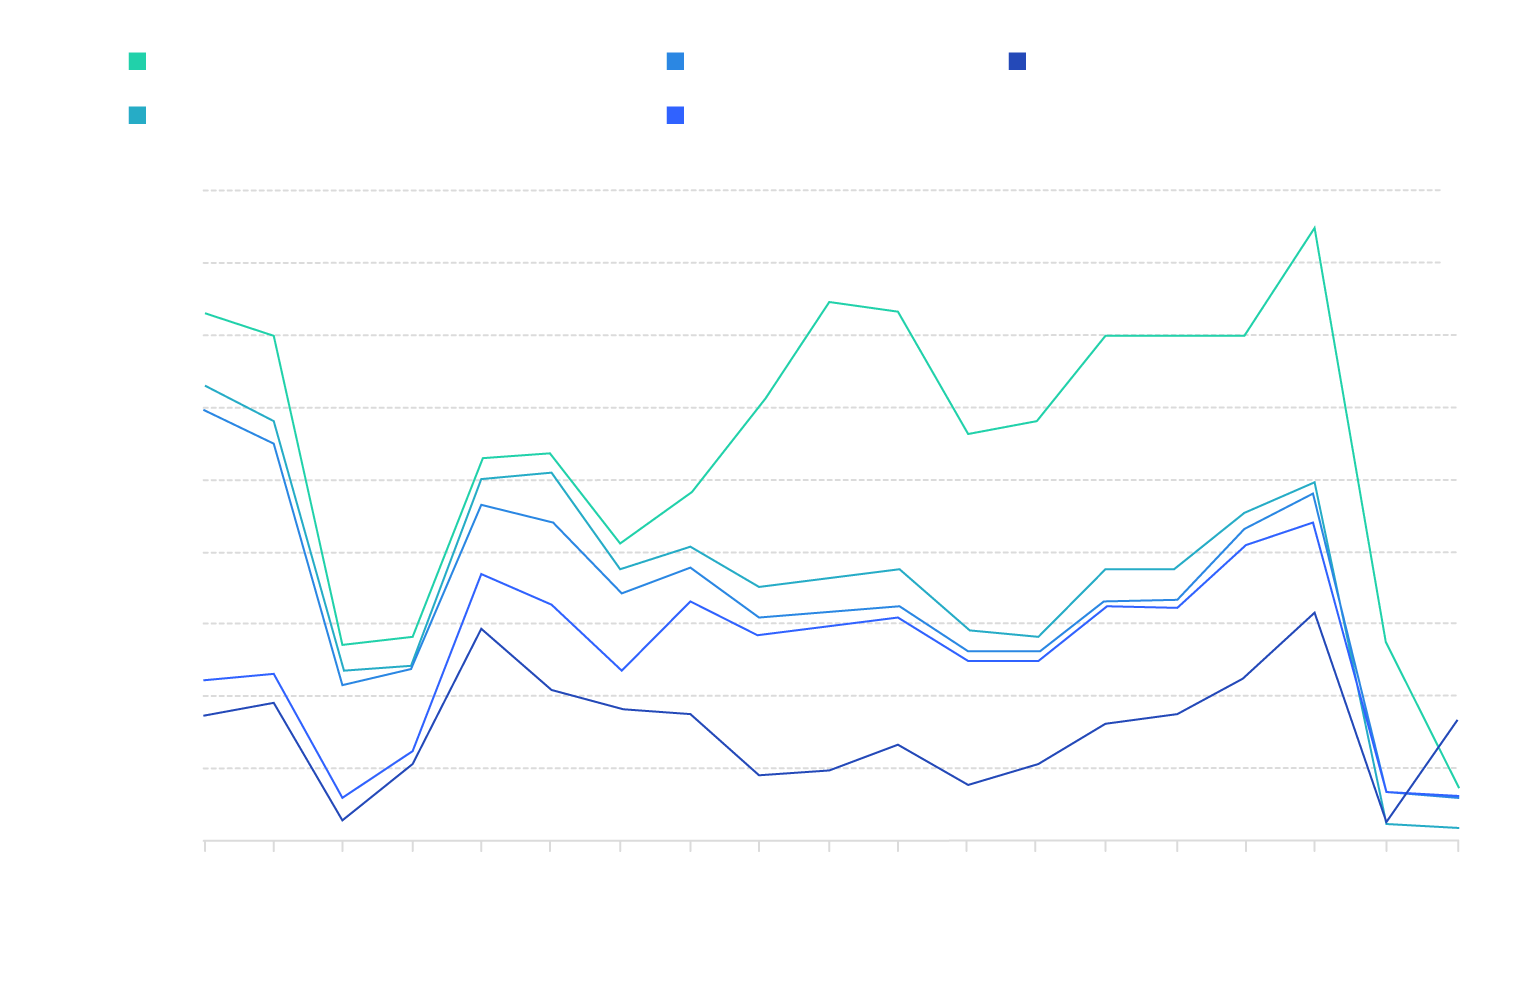
Near East/South Asia
Europe
Africa
Latin America/Caribbean
East Asia
90,000
80,000
Refugee Admissions
70,000
60,000
50,000
40,000
30,000
20,000
10,000
0
‘00
‘01
‘02
‘03
‘04
‘05
‘06
‘07
‘08
‘09
‘10
‘11
‘12
‘13
‘14
‘15
‘16
‘17
‘18*
Fiscal Year
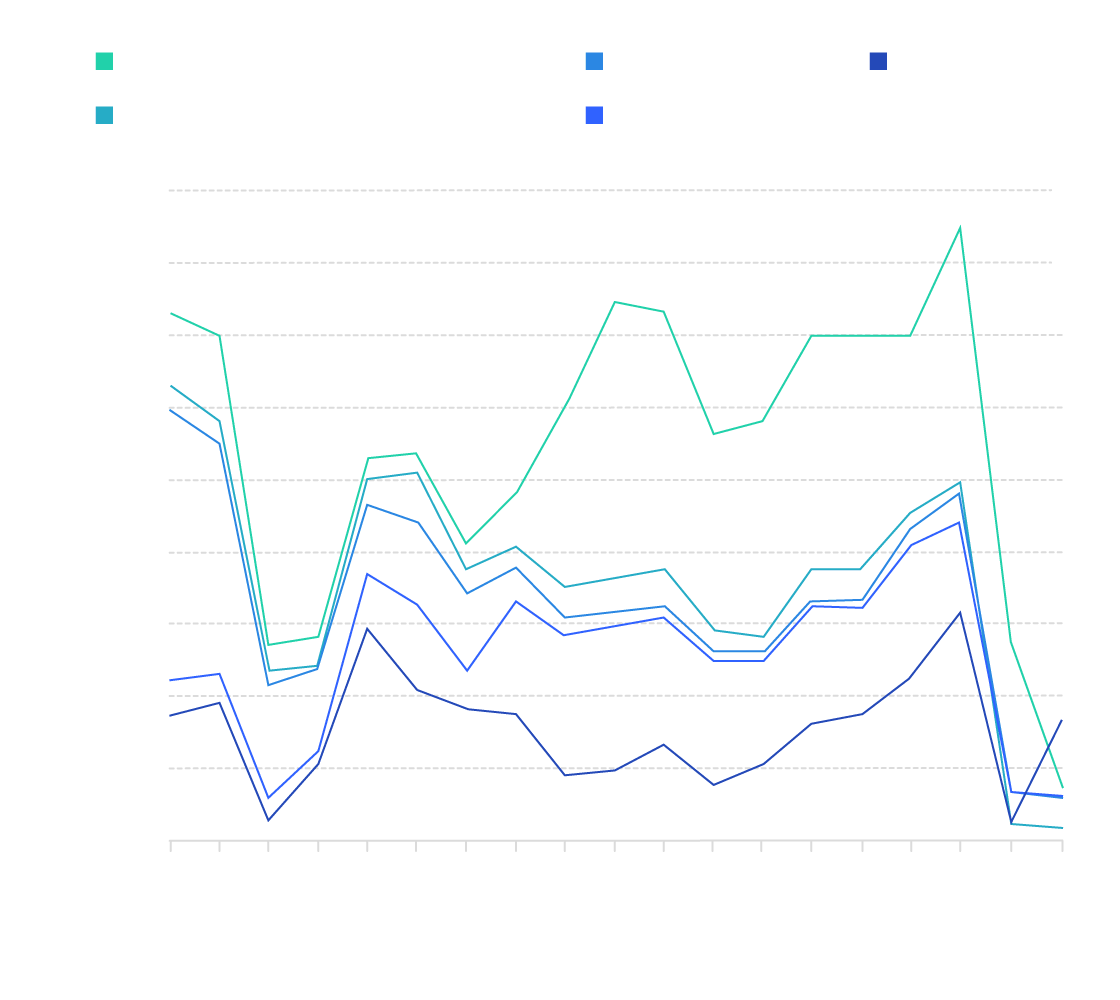
Near East/South Asia
Europe
Africa
Latin America/Caribbean
East Asia
90,000
80,000
Refugee Admissions
70,000
60,000
50,000
40,000
30,000
20,000
10,000
0
‘00
‘05
‘10
‘15
‘18*
Fiscal Year
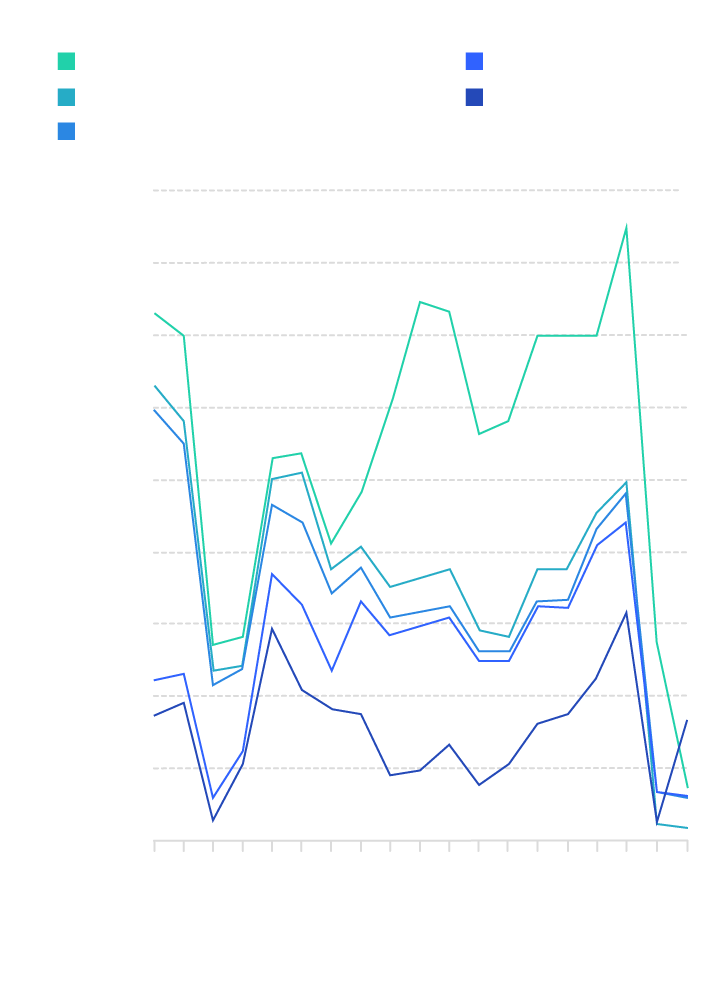
Near East/South Asia
East Asia
Latin America/Caribbean
Africa
Europe
90,000
80,000
70,000
Refugee Admissions
60,000
50,000
40,000
30,000
20,000
10,000
0
‘00
‘05
‘10
‘15
‘18*
Fiscal Year
Near East/South Asia
Latin America/Caribbean
Europe
East Asia
Africa
90,000
80,000
70,000
Refugee Admissions
60,000
50,000
40,000
30,000
20,000
10,000
0
‘00
‘05
‘10
‘15
‘18*
Fiscal Year