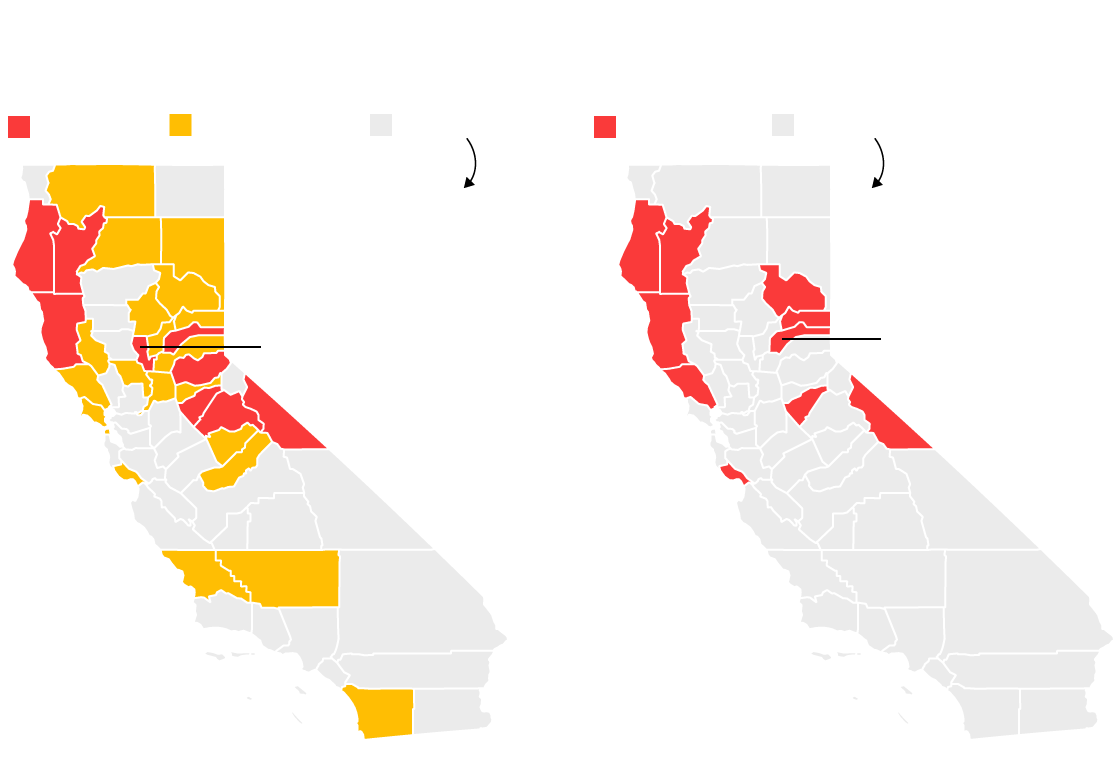
California counties with the lowest vaccination rates
California counties with the highest rates of medical exemptions
90% - 95%
>95.1%
<0.7%
<89.9%
0.8%-7.7%
Statewide average
Statewide average
Nevada County
7.7%
Sutter County
78.2%
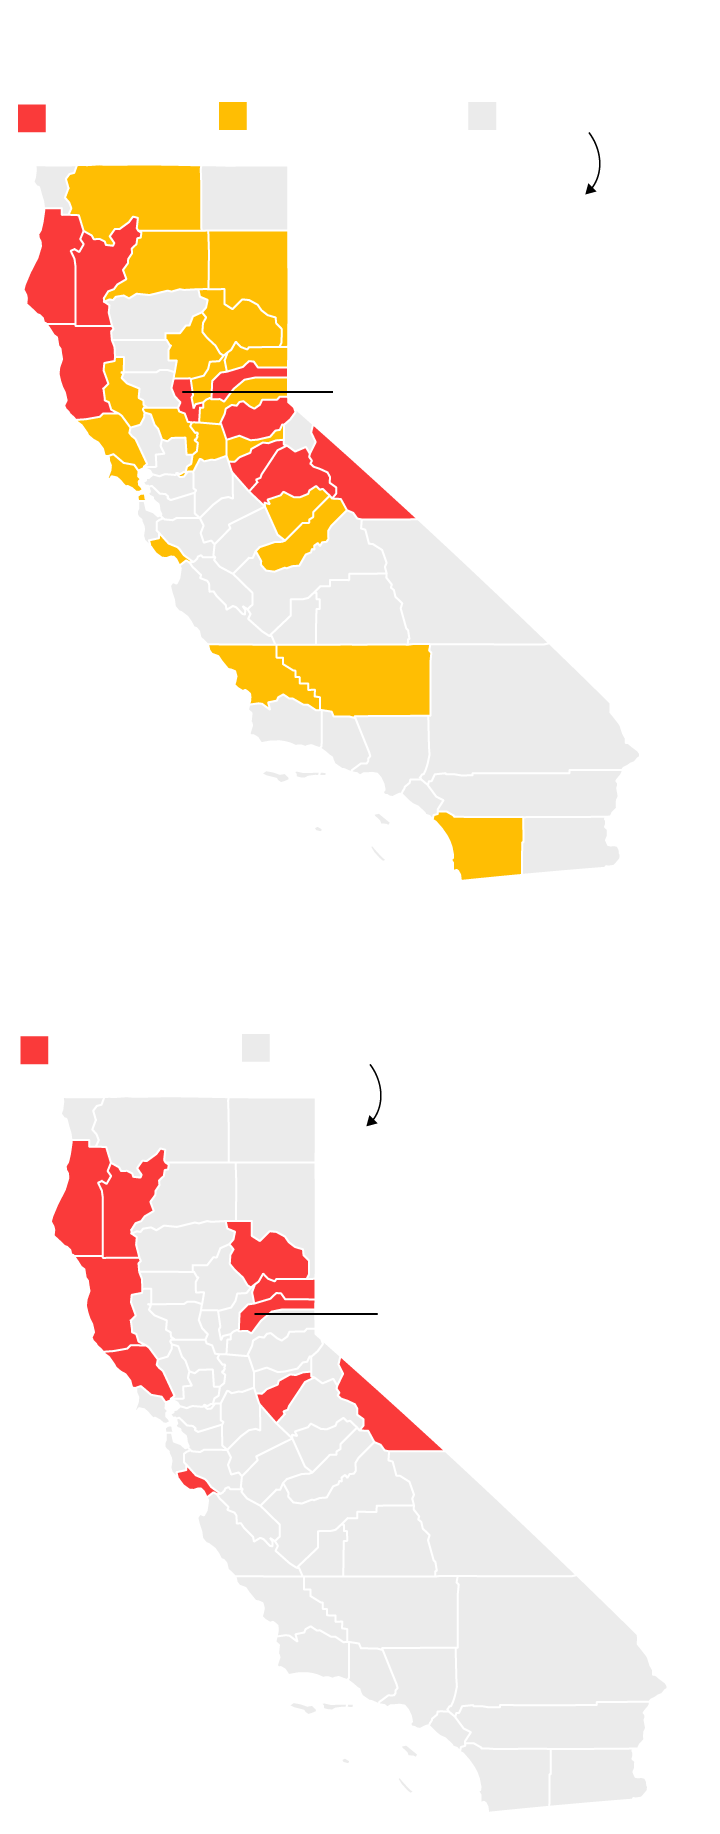
California counties with the lowest vaccination rates
90% - 95%
>95.1%
<89.9%
Statewide average
Sutter County
78.2%
California counties with the highest rates of medical exemptions
<0.7%
0.8%-7.7%
Statewide average
Nevada County
7.7%
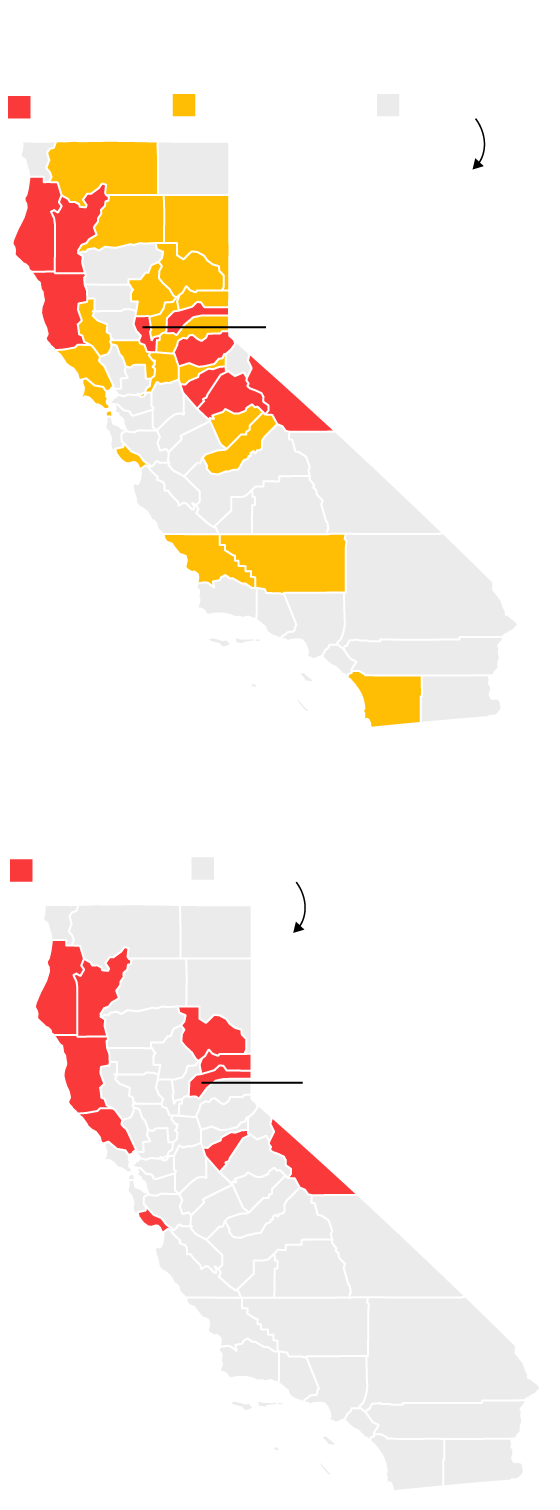
California counties with the lowest vaccination rates
90% - 95%
>95.1%
<89.9%
Statewide average
Sutter County
78.2%
California counties with the highest rates of medical exemptions
<0.7%
0.8%-7.7%
Statewide average
Nevada County
7.7%