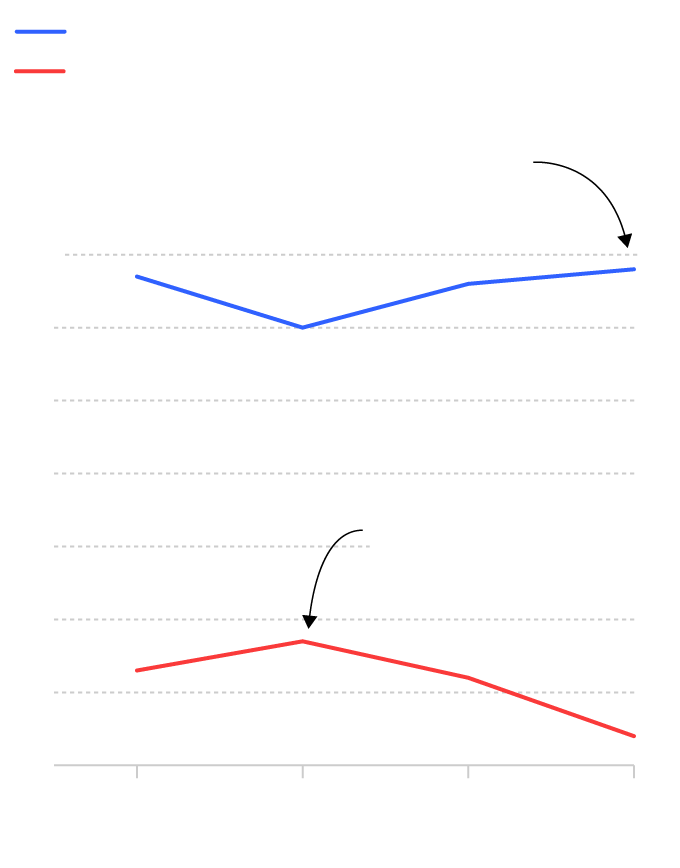
Democratic candidate
Republican candidate
78% of LGBT voters for a Democratic
candidate in 2016
80%
70
60
50
27% of LGBT voters for a Republican
candidate in 2008
40
30
20
10
2004
2008
2012
2016
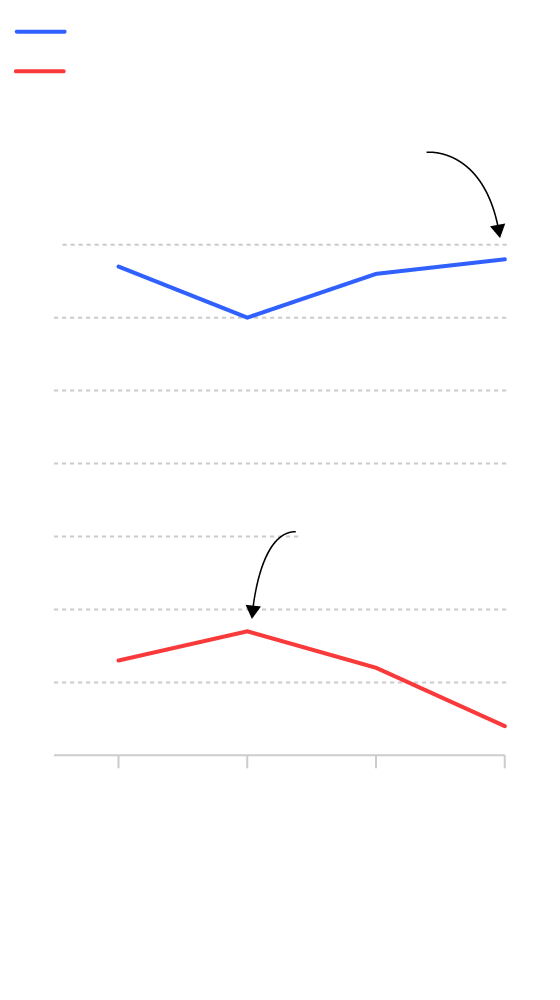
Democratic candidate
Republican candidate
78% of LGBT voters for a Democratic
candidate in 2016
80%
70
60
50
27% of LGBT voters for a Republican
candidate in 2008
40
30
20
10
2004
2008
2012
2016
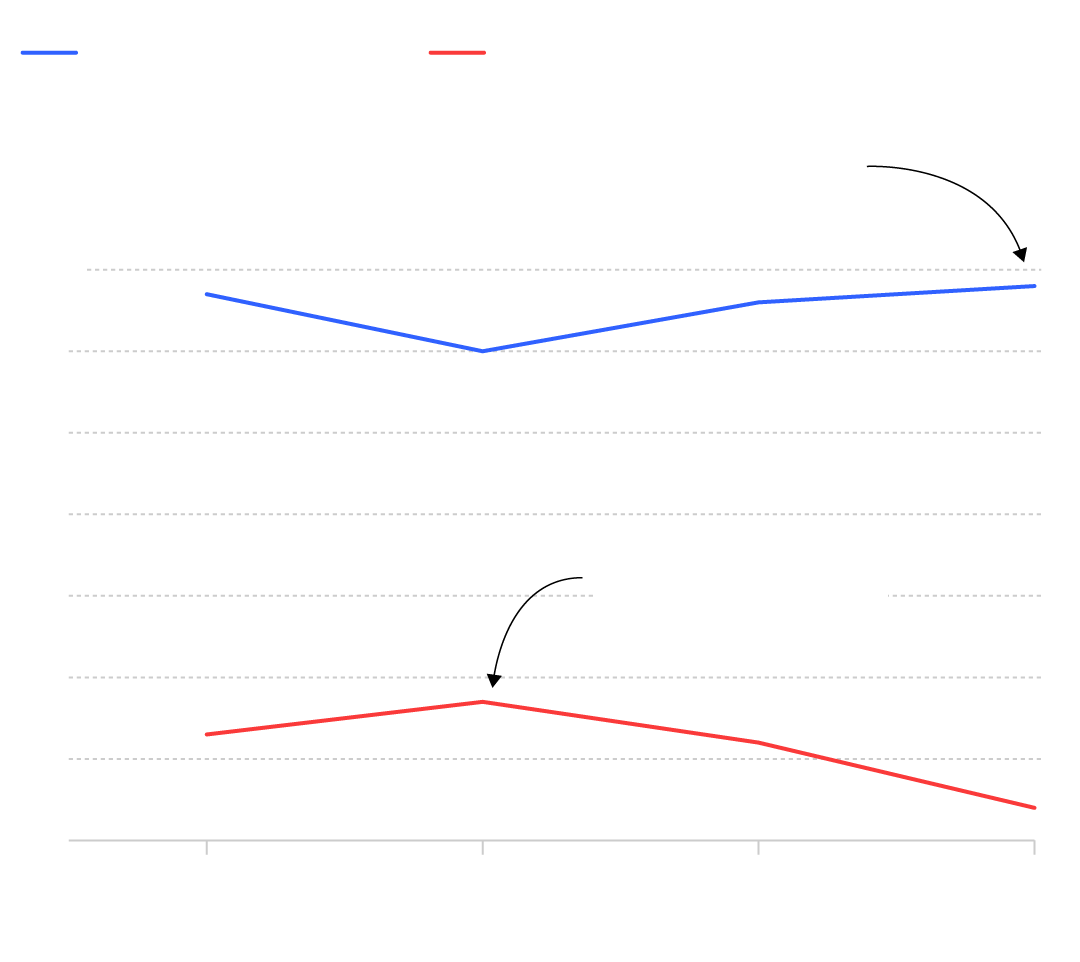
Democratic candidate
Republican candidate
78% of LGBT voters for a Democratic
candidate in 2016
80%
70
60
50
27% of LGBT voters for a Republican
candidate in 2008
40
30
20
10
2004
2008
2012
2016